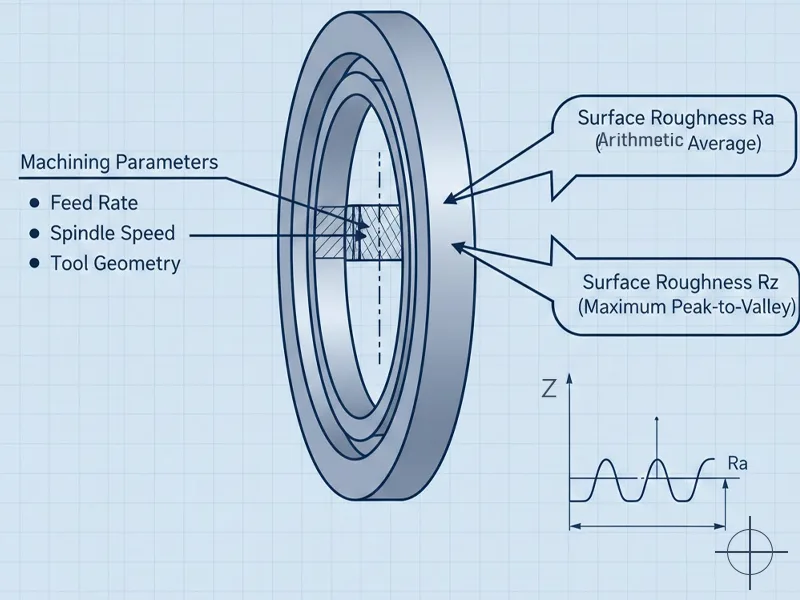
In the precision manufacturing of mechanical seals, controlling surface topography is not merely about achieving a “smooth” finish; it is a critical tribological engineering challenge. The interaction between machining parameters—specifically feed rate, cutting speed, and depth of cut—directly dictates the generated surface profile, which we quantify primarily through Arithmetic Mean Deviation (Ra) and Maximum Height of the Profile (Rz).
Modifying machining dynamics fundamentally alters these metrics. For instance, in a controlled turning operation on 316L stainless steel, reducing the feed rate from a standard roughing value to a finishing feed can shift the theoretical roughness significantly. A theoretical Ra of 3.2 µm typically correlates with an Rz range of 11.5–34.7 µm, depending on the tool nose radius and material ductility. Conversely, aggressive material removal resulting in an Ra of 50 µm yields a drastic increase in Rz to 156.2–272.6 µm, creating deep valleys that compromise seal integrity.
The relationship between these parameters is often modeled using power-law equations derived from statistical regression (e.g., Response Surface Methodology), confirming that leakage rates and abrasive wear are functionally dependent on the amplitude of these surface asperities. Consequently, selecting the optimal process parameters is essential for ensuring hydrodynamic stability and minimizing leakage in high-performance seals.
Table of Contents
Understanding Ra and Rz Roughness Metrics
To optimize mechanical seals, we must move beyond colloquial definitions and utilize strict metrological standards defined by ISO 4287 and ASME B46.1.

Ra Definition and Significance
Ra (Arithmetic Mean Deviation) serves as the primary statistical descriptor of surface topography. It is defined mathematically as the integral of the absolute value of the roughness profile height over the evaluation length:
This metric provides a global average of the peaks and valleys relative to the mean line. However, in sealing applications, Ra acts effectively as a screening parameter. A lower Ra generally indicates a superior bearing area ratio, which is critical for static sealing surfaces to prevent permeation paths.
Table 1: Application-Specific Ra Classifications
| Ra Value (μm) | Surface Condition Classification | Engineering Application Context |
|---|---|---|
| 0.025–0.2 | Super Precision Polishing | Optical components, high-load tribological bearings, cryogenic seals |
| 0.2–0.8 | Precision Machining | Hydraulic spool valves, dynamic mechanical seal faces, injection molds |
| 0.8–3.2 | Standard Machining | General power transmission gears, non-sealing shaft surfaces |
Rz Definition and Comparison to Ra
While Ra provides an average, it often masks isolated defects that can cause catastrophic seal failure. Rz (Mean Roughness Depth) is defined under DIN/ISO standards as the arithmetic mean of the single roughness depths of consecutive sampling lengths.
This metric is sensitive to extreme peak-to-valley excursions. In the context of mechanical seals, Rz is the critical determinant of the “gap height,” which influences the fluid film thickness. A surface with a low Ra but high Rz implies the presence of deep scratches or spikes (high kurtosis), which act as stress concentrators or leakage channels. Therefore, dual-parameter specification (Ra and Rz) is mandatory for ensuring the functional reliability of the seal interface.
Measurement Methods for Surface Roughness
Accurate verification requires selecting the appropriate metrology technique based on the component’s geometry and the required resolution.
- Stylus Profilometry (Contact): The industry standard for production environments. A diamond stylus (typically 2µm or 5µm radius) physically traces the profile. It is robust but can induce micro-scratching on soft materials like PTFE or soft copper.
- Optical Profilometry (Non-contact): Utilizes White Light Interferometry (WLI) or confocal microscopy to generate 3D areal maps (Sa, Sz). This eliminates surface damage and is superior for analyzing complex textures on elastomeric seals.
- Atomic Force Microscopy (AFM): Reserved for nano-scale characterization of ultra-precision surfaces where roughness is measured in angstroms.
For most machined metal seals, stylus profilometry with a correctly selected cutoff wavelength (ℷc) provides sufficient data density for quality control.
Key Machining Parameters Influencing Surface Finish
The generation of surface roughness is a deterministic process governed by the kinematics of the cutting tool. The theoretical surface roughness (Rth) in turning operations is derived from the tool geometry and feed rate.

Feed Rate and Its Effect on Roughness
Feed per revolution (f) is the dominant variable influencing surface topography. According to the Bauer-Brammertz formula, the theoretical arithmetic roughness is proportional to the square of the feed rate:
where ṛϵ is the tool nose radius. Doubling the feed rate theoretically quadruples the peak-to-valley height, although empirically, Ra often increases by approximately 30-50% due to plastic deformation and elastic recovery. Higher feed rates generate distinct helical feed marks (scallops), increasing Rz and creating leakage paths if the lay is perpendicular to the sealing axis. Conversely, utilizing a larger tool nose radius allows for higher feed rates while maintaining a lower Rz.
Cutting Speed and Surface Quality
Cutting speed (Vc) influences roughness primarily through thermal and tribological mechanisms. At low cutting speeds, the formation of a Built-Up Edge (BUE)—where workpiece material welds to the cutting tip—drastically degrades surface finish, leading to erratic Ra and Rz values.
Increasing Vc elevates the cutting temperature, softening the material in the shear zone and inhibiting BUE formation. This results in a cleaner shear mechanism and a reduction in surface irregularities. However, this relationship is non-linear; excessive speeds can accelerate flank wear (VB), which eventually degrades the surface finish. Therefore, finding the “high-efficiency range” where BUE is eliminated but tool wear is linear is critical for consistent seal production.
Tool Material and Geometry in Machining
The selection of cutting tool substrates and macro-geometry defines the lower limit of achievable roughness.
- Material: Polycrystalline Diamond (PCD) and cermet grades possess low coefficients of friction and high thermal conductivity, significantly reducing adhesion and resulting in lower Ra values compared to standard carbides.
- Geometry: Wiper insert geometry is a game-changer. By incorporating a minor cutting edge with a large effective radius, wiper inserts essentially “iron” the feed marks, decoupling the strict relationship between feed rate and roughness. This allows Ra < 0.8 µm to be achieved even at higher feed rates.
Depth of Cut and Surface Texture
While less dominant than feed, the depth of cut (ap) must exceed the tool’s edge radius to avoid the “ploughing” effect. Shallow cuts below this threshold cause rubbing rather than shearing, increasing work hardening and surface stress. Conversely, excessive depth of cut increases cutting forces and can induce regenerative chatter (vibration), which manifests as chatter marks on the seal face, causing immediate inspection failure.
Furthermore, controlled texturing (e.g., laser surface texturing or specialized milling patterns) can create micro-hydrodynamic reservoirs. These intentional “valleys” retain lubricant, thereby improving the seal’s tribological performance.
Coolant, Lubrication, and Machining Practices
The thermal and lubrication environment at the cutting zone is pivotal. High-pressure coolant delivery assists in chip evacuation, preventing chip re-cutting, which scars the surface.
Table 2: Coolant Influence on Surface Integrity
| Parameter | Mechanism of Action | Impact on Seal Surface Integrity |
| Coolant Stability | Thermal stabilization | Maintains dimensional tolerance and prevents thermal expansion errors |
| Lubricity | Reduction of shear friction | Prevents adhesive wear (galling) on the workpiece surface |
| Chip Evacuation | High-velocity flushing | Prevents recutting of chips, eliminating random surface scratches |
Proper concentration management (typically 8-12% for superalloys) ensures the formation of a robust tribo-film during machining.
CNC Machining and Surface Roughness Optimization
Modern Computer Numerical Control (CNC) represents the integration of deterministic control logic with high-rigidity mechanics to achieve sub-micron surface fidelity.

CNC Technology for Precision Seals
Advanced CNC platforms utilize high-frequency look-ahead algorithms and jerk control to smooth the acceleration/deceleration profiles of the axes. This dynamic control minimizes servo lag and vibration transfer to the workpiece. Furthermore, active thermal compensation systems adjust the tool path in real-time to counteract spindle growth, ensuring that the Rz and dimensional tolerances remain stable throughout long production runs of seal components
Achieving Consistent Ra and Rz with CNC Machining
Process capability indices (Cp, Cpk) for surface roughness rely on the repeatability of the CNC process. By locking in optimal cutting parameters—specifically Constant Surface Speed (CSS) control—CNC lathes maintain a uniform cutting velocity across changing diameters, which is vital for face seals. Since Rz variations are often precursors to tool failure, monitoring spindle load and vibration signatures allows for predictive tool changes before surface degradation occurs.
Quality Control in CNC Machining
Quality assurance in seal manufacturing is evolving from post-process sampling to in-process verification.
- In-Process Probing: Renishaw-type probes verify datum stability but are generally too coarse for roughness.
- Statistical Process Control (SPC): Routine sampling of Ra and Rz (e.g., every 10th part) charts trends. An upward trend in Rz typically signals the onset of tool flank wear.
- Standards: For static O-ring grooves, an Ra of 1.6–3.2 µm is often specified to provide friction for retention. For dynamic metal-to-metal rotary seals, specifications often tighten to Ra 0.4–0.8 µm with strict flatness requirements.
Impact of Surface Roughness on Seal Performance
The surface topography determines the lubrication regime—boundary, mixed, or hydrodynamic—under which the seal operates.
Friction and Wear in Seals
The Stribeck curve illustrates the relationship between friction, viscosity, speed, and roughness. A surface that is too rough (Ra > 1.6 µm) operates in the boundary lubrication regime, where asperity contact leads to abrasive wear and high frictional heat. Conversely, “super-finished” surfaces (Ra < 0.1 µm) can result in “stiction” (high static friction) or adhesive wear due to the lack of lubricant retention volume, leading to immediate seal failure upon startup.
Sealing Effectiveness and Leakage Prevention
Leakage through a seal interface can be modeled as flow through a porous medium where the “pores” are the connected valleys of the surface texture.
Table 3: Roughness vs. Leakage Flow Rates (Based on Empirical Models)
| Seal Condition | Average Roughness (Ra) | Kurtosis Rku | Leakage Rate (mL/h) | Failure Mode Analysis |
| Worn Seal | 0.09 – 0.14 μm | > 10 (Spiky) | ~12.0 | Leakage via deep scratches (Rz driven) |
| New Seal | 0.12 – 0.20 μm | ~3 (Gaussian) | Minimal | Proper asperity deformation seals gaps |
High kurtosis values (Rku > 3) indicate sharp peaks that can abrade mating elastomeric elements, while negative skewness (Rsk) indicates a surface with more valleys, which is generally preferred for fluid retention.
Lubrication and Fluid Retention
The Abbott-Firestone curve (Bearing Area Curve) is essential for understanding fluid retention. A plateau-honed surface features flat peaks for load bearing and deep valleys for oil retention. This specific topography ensures a hydrodynamic fluid film is maintained even under slow speeds or high loads, preventing metal-to-metal contact.
Recommendations for Machining Parameters and Surface Roughness
Ideal Ra and Rz Ranges for Seals
Specification of roughness must be material and application-specific. The following ranges represent industry best practices for standard seal applications.
Table 4: Recommended Roughness Parameters by Seal Type
| Seal Category | Recommended Ra (µm) | Max Rz (µm) | Process Note |
| Radial Shaft Seal (Dynamic) | 0.2 – 0.8 | < 3.0 | Plunge ground or hard turned; avoid lead (twist) |
| Static Piston/Rod Seals | 0.4 – 1.6 | < 6.3 | Smooth enough to seal, rough enough to hold position |
| Metal Face Seals | 0.1 – 0.2 | < 1.0 | Requires lapping or superfinishing |
Best Machining Practices for Surface Quality
Achieving these values consistently requires a rigid process strategy:
- Roughing/Finishing Segregation: Never use the same tool for roughing and finishing. Tool wear from roughing will instantly degrade the finish pass.
- Chip Management: Use high-pressure coolant to clear chips. Recutting chips is a primary cause of random Rz spikes.
- Advanced Finishing: For requirements below Ra 0.4 µm, transition from turning to grinding, honing, or roller burnishing. Burnishing effectively compresses peaks, improving the bearing area ratio without material removal.
Inspection and Troubleshooting Techniques
If roughness values drift out of tolerance:
- Check Tool Wear: Inspect flank wear (VB). If VB > 0.2mm, replace the insert.
- Verify Harmonics: Check for chatter frequencies. Change spindle speed by ±10% to disrupt harmonic resonance.
- Audit Metrology: Ensure the stylus tip radius (2µm vs 5µm) matches the drawing requirement, as a larger tip acts as a mechanical filter, artificially smoothing the reading.
FAQ
While stylus profilometry is standard for process control, White Light Interferometry (Optical) is the definitive method for critical seal faces. It provides a non-destructive, 3D topographical map that reveals lay patterns and defect volumes missed by a 2D stylus trace.
When you make the feed rate higher, the surface gets rougher. If you lower the feed rate, the surface gets smoother. Always pick the feed rate that matches The relationship is quadratic. Theoretically, therefore, halving the feed rate will reduce the theoretical roughness by a factor of four, assuming the cut remains stable and above the “minimum chip thickness” threshold.
Ra is an average and can hide defects. Rz measures the vertical distance between the highest peak and the lowest valley. In sealing, a single deep valley (high Rz) can form a leak path for pressurized fluids, even if the average roughness (Ra) appears acceptable.
Extremely smooth surfaces can suffer from adhesive wear (galling) and stick-slip phenomena. Without sufficient texture to retain a lubricant reservoir, the seal face may run dry during startup, leading to rapid thermal degradation.
Sampling frequency depends on the Cpk of the process. Typically, a 100% visual inspection combined with a 1-in-10 or 1-in-20 tactile measurement is standard. SPC charts should be maintained to detect tool wear trends before non-conforming parts are produced .
Absolutely. Cermet and PCD tools have lower chemical affinity to steels and aluminum than standard carbides, reducing micro-welding (BUE) and producing a naturally glossier, lower Ra finish at equivalent feed rates.
